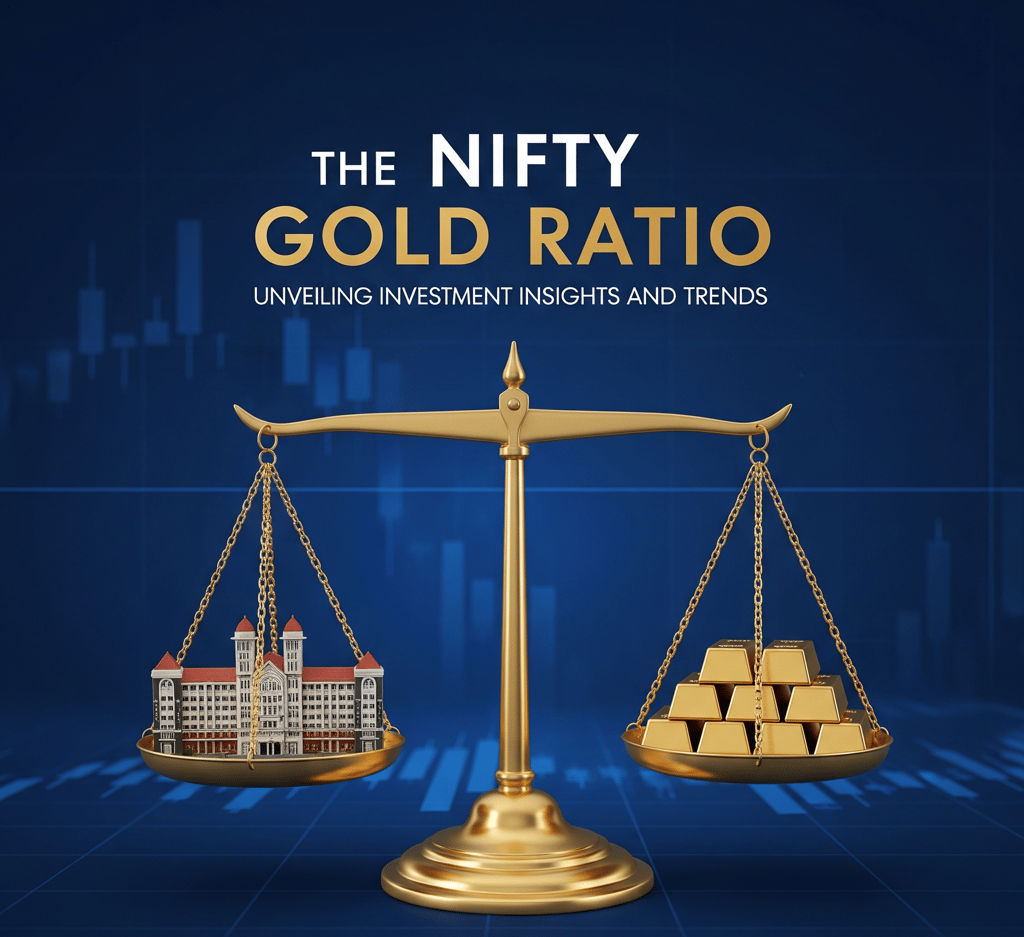
Nifty-Gold Ratio Near Historic Lows: Is India’s Next Bull Market About to Begin?
In the world of macro indicators, few signals have proven as consistently prescient as the Nifty-Gold ratio. This deceptively simple metric—calculated by dividing the Nifty 50 index by the price of gold—offers a window into investor psychology, risk appetite, and asset rotation.
Arjun K A
9/9/20254 min read
Historically, when the ratio dips below ~2.65, it has marked a turning point: a moment when fear peaks, gold becomes the safe haven, and equities are temporarily abandoned. But once sentiment shifts, the rebound in equities has been nothing short of explosive.
As of September 2025, the ratio is hovering around 2.67, brushing against its historical support zone. Could this be the calm before another storm of bullish momentum?
📚 Historical Patterns: When Fear Turns to Greed
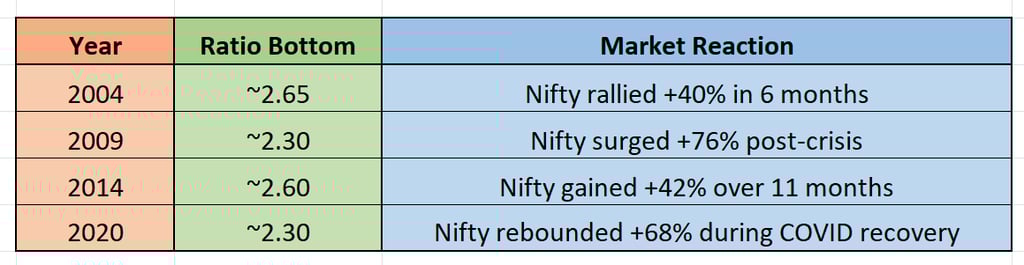
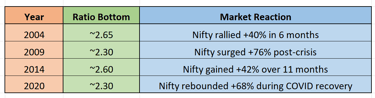
Let’s revisit the four major inflection points over the past two decades:
Each time the ratio dipped below 2.65, it reflected heightened risk aversion. Investors fled equities and piled into gold. But once macro stability returned, confidence surged—and so did the Nifty.
📉 Present Context: September 2025 Snapshot
Today, the Nifty 50 is hovering around 25,000, facing resistance at that psychological level. Meanwhile, gold has rallied nearly 39% year-to-date, driven by geopolitical tensions, central bank buying, and weakening confidence in global fiscal stability. This surge in gold has pushed the Nifty-Gold ratio back toward its historical floor.
What does this mean? Investors are once again showing signs of caution. But history suggests that this caution often precedes a powerful equity rebound.
🔮 Extrapolation: What Could Happen Next?
📈 Bullish Scenario: The Setup for a Breakout
If the Nifty-Gold ratio rebounds from this support zone, it could signal a shift in sentiment. A breakout above 25,250 would confirm bullish momentum. From there, the Nifty could embark on a 6–12 month rally, potentially gaining 40% to 75%, based on historical precedents.
That would place the Nifty in the 35,000–43,000 range by mid-to-late 2026 or early 2027—a bold but historically grounded projection.
🧠 Sentiment Shift: Confidence Returning to Equities
A rising ratio implies that equities are outperforming gold. This typically happens when:
Inflation fears subside
Interest rates stabilize or decline
Corporate earnings improve
Global risk appetite returns
In 2025, several of these conditions are beginning to align. The U.S. Federal Reserve is signaling dovish policy shifts, and Indian corporates are showing resilience despite global headwinds. If these trends continue, the rotation from gold to equities could accelerate.
🧮 Technical & Fundamental Confluence
🔧 Technical Indicators
Support Zone: Nifty-Gold ratio near 2.65
Resistance Levels: Nifty at 25,000 and 25,125
Breakout Trigger: Sustained volume above resistance
📊 Fundamental Drivers
Gold Overbought: With gold prices at record highs, upside may be limited
Equity Valuations: Reasonable compared to global peers
Domestic Growth: India’s GDP growth remains robust, supported by consumption and infrastructure spending
⏳ Time Horizon: What to Expect
Historically, rallies triggered by this ratio have lasted between 6 to 12 months, with gains ranging from 40% to 75%. Investors who recognized the signal early—whether in 2009 post-crisis or in 2020 during the COVID recovery—were rewarded handsomely.
If the current setup follows the same trajectory, the window for accumulation may be narrow. The next few weeks could be pivotal.
🧠 Strategic Takeaway: How to Position Yourself
This isn’t a guarantee—it’s a probability game. But the Nifty-Gold ratio has proven to be one of the most reliable macro indicators in the Indian market. Here’s how investors can respond:
Equity Exposure: Consider increasing allocation to large-cap Indian equities, especially if Nifty breaks above 25,125
Sector Rotation: Focus on cyclical sectors—IT, financials, infrastructure—that benefit from rising confidence
Gold Strategy: Lock in profits if overweight; consider reducing exposure as sentiment shifts
Risk Management: Use stop-losses and staggered entry points to manage volatility
🧭 History Doesn’t Repeat, But It Rhymes
Markets are never identical—but they often echo the past. The Nifty-Gold ratio is whispering that a shift may be underway. Whether you’re a long-term investor or a tactical trader, this signal deserves your attention.
If the ratio rebounds and Nifty breaks out, we could be witnessing the start of India’s next great bull run.
📘 Top 15 FAQs on the Nifty-Gold Ratio
1. What is the Nifty-Gold ratio?
The Nifty-Gold ratio compares the value of the Nifty 50 index to the price of gold (typically per 10 grams in INR). It reflects how equities are performing relative to gold.
2. Why is the Nifty-Gold ratio important?
It acts as a macro sentiment indicator. A falling ratio suggests risk aversion (investors prefer gold), while a rising ratio signals confidence in equities.
3. How is the ratio calculated?
Simply divide the Nifty 50 index level by the price of gold in INR.
Formula:
Nifty-Gold Ratio = Nifty Index / Gold Price (per 10g)
4. What does a low Nifty-Gold ratio indicate?
It typically signals fear or uncertainty in the market. Investors shift toward gold, a safe-haven asset, during crises or economic downturns.
5. What does a high Nifty-Gold ratio suggest?
It reflects optimism and risk-taking behavior. Investors favor equities over gold, expecting higher returns from stocks.
6. What are the historical support and resistance levels for the ratio?
Historically, the ratio has bottomed near 2.30–2.65 and peaked around 4.00–4.05. These levels often coincide with major market turning points.
7. How has the ratio predicted past market rallies?
Each time the ratio dipped below ~2.65 (2004, 2009, 2014, 2020), the Nifty rallied between 40% to 76% over the next 6–12 months.
8. Is the ratio useful for long-term investors?
Yes. It helps in dynamic asset allocation—favouring gold during uncertainty and shifting to equities during growth phases.
9. Can both Nifty and gold rise together?
Yes. The ratio may still fall if gold rises faster than Nifty. Conversely, it may rise if Nifty outpaces gold—even if both are climbing.
10. Is the ratio affected by global events?
Absolutely. Crises like the 2008 financial meltdown or COVID-19 caused the ratio to drop sharply, reflecting global risk aversion.
11. How can investors use this ratio in portfolio strategy?
Use it as a guide for asset rotation:
Low ratio → Increase gold exposure
High ratio → Increase equity exposure
12. Is the ratio relevant only for Indian markets?
Primarily yes, since it uses the Nifty 50 and gold priced in INR. However, similar ratios exist globally (e.g., S&P 500 vs. Gold).
13. What’s the current trend in 2025?
As of September 2025, the ratio is around 2.67, testing its historical support zone. This could signal a potential equity rebound.
14. Does the ratio work in sideways markets?
It’s less predictive during flat markets but still useful for spotting relative strength between asset classes.
15. Is the Nifty-Gold ratio a guaranteed signal?
No indicator is foolproof. While historically reliable, it should be used alongside other technical and fundamental tools for confirmation.
Disclaimer :
This content is for informational purposes only and not investment advice. Past performance is not indicative of future results—consult a licensed adviser before investing.
to schedule a free introductory appointment
+91 81234 26999
FINSPIREYOU@OUTLOOK.COM
© 2026 All Rights Reserved Sukruthi Finspire You
Registration granted by SEBI (INA000020493) , Membership of Bombay Stock Exchange (BSE Enlistment number 2288), and certification from the National Institute of Securities Markets (NISM) in no way guarantee the performance of the Investment Advisor or provide any assurance of returns to Investors. Investments in the securities market are subject to market risks. Read all the related documents carefully.
ARJUN K A
pROPRIETOR sUKRUTHI