US National Debt 2026: Why the $38.5T Crisis and Trade Shifts Matter
America’s twin fiscal challenges, explaining why the current strategy of aggressive trade barriers and government efficiency is a high-stakes of the nation's future.
Arjun K A
1/10/20266 min read


America’s twin fiscal challenges, explaining why the current strategy of aggressive trade barriers and government efficiency is a high-stakes of the nation's future.
1. The Trade Deficit: From Global Buyer to Strategic Seller
A trade deficit occurs when a nation’s appetite for foreign goods (Imports) exceeds what it sells abroad (Exports). For decades, the U.S. has run the world’s largest trade deficit, effectively acting as the global "consumer of last resort."
The 2026 Snapshot: Narrowing down
As of January 2026, the U.S. trade deficit has hit its lowest levels since the 2008 financial crisis, recently narrowing to approximately $29.4 billion in a single month. This isn't an accident; it's the result of three strategic shifts:
Energy as an Export Engine: The U.S. is now a dominant net exporter of oil and natural gas, reversing a 50-year trend of energy dependence.
The Tariff Wall: Effective tariff rates on imports (particularly from China and nations buying Russian oil) have surged, reaching as high as 17–20% on average.
Strategic Onshoring: Supply chains for semi-conductors and EVs have migrated back to the "Rust Belt," reducing the need for foreign-made components.
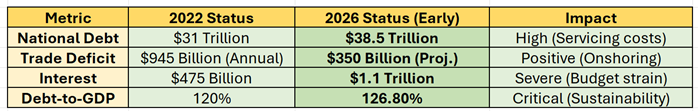
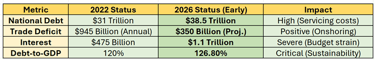
2. The National Debt: The $38.5 Trillion Milestone
If the trade deficit is our "shopping bill," the national debt is the cumulative "credit card balance" the government owes.
By January 2026, the U.S. National Debt surpassed $38.5 trillion. The professional concern today isn't just the total amount, but the cost of carrying it.
The Interest Burden: For the first time, annual interest payments have crossed $1 trillion, now exceeding the entire U.S. defense budget.
The Debt-to-GDP Ratio: Currently hovering around 126%, meaning we owe significantly more than our entire economy produces in a year.
The "Debt Wall": In 2026, nearly $9 trillion in short-term debt is maturing. The government must borrow new money at current (higher) interest rates to pay off the old debt.
3. The "Twin Deficit" Hypothesis: How They Connect
Professionally, we view these two as a circular flow. When the U.S. buys foreign goods (trade deficit), those dollars end up in foreign central banks. Those banks often use those dollars to buy U.S. Treasury Bonds, effectively lending the money back to the U.S. government to fund its budget.
The 2026 Shift: As the U.S. aggressively narrows its trade deficit, there are fewer "recycled dollars" abroad to buy our debt. This forces the U.S. to look elsewhere for lenders, often leading to higher interest rates to attract domestic investors.
4. The Advisory Perspective: Strategic Risks & Solutions
Going forward, the "American Problem" isn't just about debt—it's about solvency vs. inflation.
Summary: The Advisor’s Verdict
US in 2026 is attempting a "controlled re-entry." We are shrinking our reliance on foreign trade while trying to grow our way out of a mountain of debt.
The goal: Achieve a GDP growth rate of 5% (as currently projected) to outpace the interest on our debt. If growth stays high and the trade balance stays narrow, the U.S. can maintain its superpower status. If growth stalls, the interest burden could trigger a fiscal crisis.
Comparison: The 2026 Economic Pulse
10 specific ways these 2026 interest rates are impacting Americans and the rest of the world:
Impact on Americans (The Domestic Front)
The Mortgage "Lock-In" Eases: With 30-year fixed mortgage rates averaging around 6.1% in early 2026 (down from 7.5% in 2024), the "lock-in effect" is finally thawing. Homeowners who were stuck in 3% mortgages are starting to move, but new buyers still face monthly payments roughly 40% higher than pre-2022 levels.
Credit Card "Debt Trap": Despite Fed cuts, credit card APRs remain stuck near 20–22%. With the average household carrying more debt due to 2025's tariff-driven inflation, interest charges are consuming a record portion of disposable income.
The Return of the "Savers' Era": For the first time in twenty years, Americans are seeing meaningful returns on "boring" investments. High-yield savings accounts and 1-year CDs are still offering 3.5% to 4%, rewarding those with cash and penalizing those who need to borrow.
Auto Loan Sticker Shock: The average interest rate on a new car loan is hovering near 7.5%. This has pushed the "affordable" car further out of reach, leading to a surge in the 84-month (7-year) loan market as consumers try to lower monthly payments.
Small Business Squeeze: Small businesses, which often rely on floating-rate lines of credit, are seeing their "cost of capital" stay high. This has slowed down hiring in early 2026, as owners prioritize debt service over expansion.
Impact on Other Countries (The Global Ripple)
The "Dollar Hegemony" Tax: Because U.S. rates are higher than those in Europe or Japan, global capital is flowing into the U.S. to chase higher yields. This keeps the U.S. Dollar strong, making it more expensive for other countries to buy oil, grain, and medicine (which are priced in dollars).
Emerging Market Debt Distress: Countries like Brazil, Turkey, and Nigeria, which borrowed heavily in U.S. dollars, are finding it harder to pay back their loans. As U.S. rates stay elevated, these nations must spend more of their local currency just to stay current on interest, leading to cuts in their own healthcare and education budgets.
Imported Inflation: When the U.S. dollar strengthens because of high rates, other currencies (like the Euro or Yen) weaken. This makes imports more expensive for those countries, effectively "exporting" American inflation to the rest of the world.
Capital Flight from Asia: Investors are pulling money out of developing Asian markets and moving it into "safe" U.S. Treasuries. To stop this "brain drain" of capital, foreign central banks are forced to keep their interest rates high, even if their local economies are weak and need a boost.
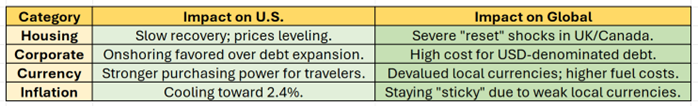
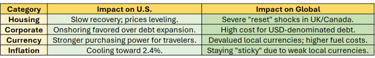
The Housing Bubble Bursting Abroad: Unlike the U.S., where 30-year fixed rates are the norm, many countries (like Canada, the UK, and Australia) use short-term adjustable mortgages. As these loans "reset" at 2026's higher rates, households in those countries are facing massive "payment shocks" that are more severe than what Americans are experiencing.
Summary Table: 2026 Rate Transmission
As of January 2026, the global economic landscape is defined by a widening gap between high-debt advanced economies and rapidly growing emerging markets. While the U.S. continues to manage a historically high debt load burden, it is not the most indebted nation relative to its economic size.
Here is the Debt-to-GDP ratio for America and the other top 9 largest economies (by nominal GDP) as of early 2026:
United States: The U.S. ratio has climbed to approximately 126.8%, driven by high interest payments on a $38.5 trillion national debt.
China: China’s general government debt-to-GDP has risen to roughly 98.2%, as the government continues fiscal stimulus to support its property sector.
Germany: Maintaining its reputation for fiscal discipline, Germany sits at a much lower 62.5%, despite increased spending on defense and green energy.
India: India has successfully brought its ratio down to 80.5% in 2026, benefiting from one of the world's fastest nominal GDP growth rates.
Japan: Japan remains the global outlier with a staggering 251.2% ratio, though it manages this through low interest rates and high domestic ownership of its debt.
United Kingdom: The UK’s ratio is hovering near 101.5%, as it struggles with sluggish growth and high public service costs.
France: France faces significant fiscal pressure with a ratio of 112.4%, leading to recent calls for aggressive budget reforms.
Italy: Within the Eurozone, Italy remains a concern with a 138.2% ratio, the highest among the top European economies.
Canada: Canada’s ratio stands at approximately 104.1%, largely influenced by high provincial-level borrowing and social spending.
Brazil: Rounding out the top ten, Brazil’s ratio is roughly 86.4%, as it balances social welfare programs with high borrowing costs.
Strategically: Why "100%" is the Red Line
In professional economics, crossing the 100% Debt-to-GDP mark is often seen as a psychological and structural threshold. When a country owes more than its entire economy produces in a year, it becomes increasingly sensitive to interest rate hikes. For the U.S. and Japan, their status as "safe havens" allows them to carry this burden, but for others, it often leads to credit rating downgrades and currency devaluation.
As we move through 2026, these high debt levels have forced a global "rating recalibration," where traditional safe havens like the U.S. and France face negative outlooks or downgrades due to persistent deficits, while emerging giants like India are seeing upgrades as their rapid GDP growth effectively "dilutes" their debt burden.
Ultimately, credit agencies are shifting their focus from the total amount of debt to the cost of servicing it, signalling that nations failing to reform their "interest-to-revenue" ratios risk higher borrowing costs that could stifle national prosperity for a generation.
to schedule a free introductory appointment
+91 81234 26999
FINSPIREYOU@OUTLOOK.COM
© 2026 All Rights Reserved Sukruthi Finspire You
Registration granted by SEBI (INA000020493) , Membership of Bombay Stock Exchange (BSE Enlistment number 2288), and certification from the National Institute of Securities Markets (NISM) in no way guarantee the performance of the Investment Advisor or provide any assurance of returns to Investors. Investments in the securities market are subject to market risks. Read all the related documents carefully.
ARJUN K A
pROPRIETOR sUKRUTHI